
2026 MARCH CONSUMER PRICE INDEX (CPI)
- Michael Thervil

- Apr 14
- 2 min read
Written by Michael Thervil

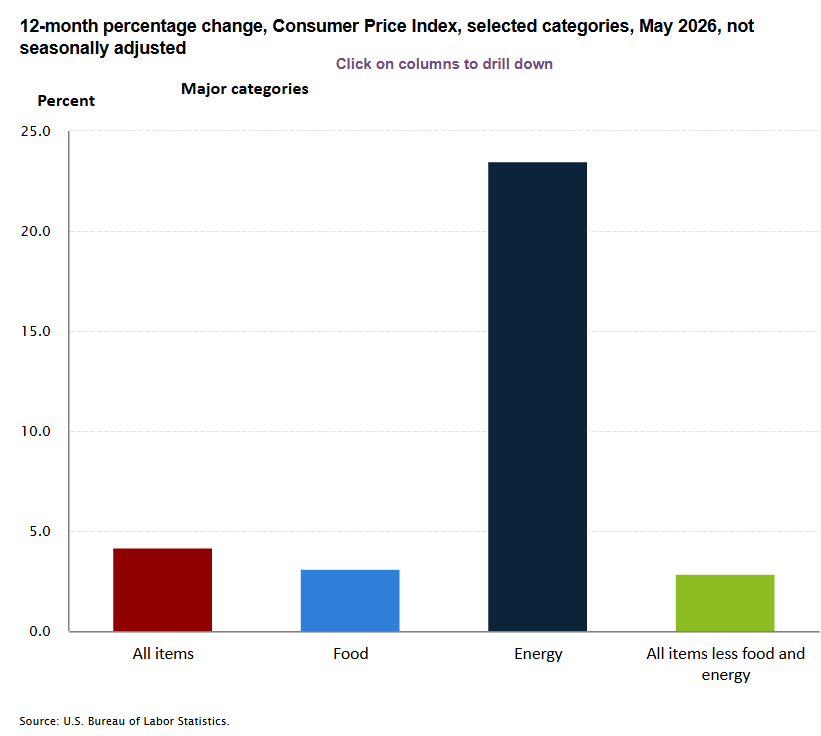
[2026 March Consumer Price Index] With the American Consumer Price Index (CPI) showing a 0.9% increase for “All Items” in the month of March from the previous month, the current increase when it comes to “All Items” stands at 3.3%. Diving into the category of “Food”, both “Food At Home” and “Food Away From Home” have both increased during the month of March. With “Food At Home” rising to 1.9% and “Food Away From Home” standing at 3.8% it shows that Americans purchased more than expected despite the increase in general pricing. In the “Food At Home” category the biggest increases were seen in “Fruits and Vegetables", "Non-Alcoholic Beverages” and “Beverage Materials” and “Other Food At Home” up 4.0%, 4.7%, and 2.9% respectively. Coming in fourth was "Cereals and Bakery Products” Which showed a 2.1% increase in the month of March. Categories that dipped into the negative were “Meats, Poultry, Fish, and Eggs” (-0.9%) and “Dairy and Related Products” (-1.6%).
Drilling down into the “food away from home”, major increases were found in the “Full-Service Meals and Snacks” and “Limited-Service Meals and Snacks” with the biggest increase between the two was “Full-Service Meals and Snacks” which increased to 4.3%. “Limited-Service Meals and Snacks” increased to 3.2%. On the surface, the biggest winner between “Food”, “Energy” and “All Items Food and Energy” was the “Energy Sector” showing a 12.5% increase, something that could possibly be attributed to the increase in oil prices and geopolitical tensions. Drilling into the “Energy Commodities” which displayed the biggest increase, for the month of March this sector grew to 19.4%. “Energy Services” also showed a somewhat moderate increase of 5.0%.
In the “Fuel Oil” sector, America's fuel oil consumption increased to a whopping 44.2% while “Gasoline (All Types)” increased to 18.9%. In the “Energy Services” sector, “Natural Gas (Piped)” grew by 6.4%. “Electricity” consumption increased to 4.6%. In the final category, “All Items Less Food and Energy” showed an overall increase of 2.6%. Drilling into this category, the largest increase came from “Services Less Energy Service” (3.0%) followed by "Commodities Less Food and Energy Commodities” grew to just over 1.0% (1.2%). Examining “Commodities Less Food and Energy Commodities” “Used Cars and Trucks” fell sharply into the negative to -3.2% while the historical trend of “Tobacco and Smoking Products” increasing to 7.4%.
The subcategory of “Appeal” registered an increase of 3.4% followed by “Alcoholic Beverages” showed a slight increase despite falling sales amongst gen z to 1.7%. Subcategories of “New Vehicles" and “Medical Care Commodities” remained flat at 0.5% and 0.3% respectively. Looking at the “Service Less Energy Services” increases were seen in the following sectors “Transportation Services” (3.7%), “Medical Care Services” (4.1%), and “Shelter” which clocked a growth increase at 3.0%


Comments