
JULY 2025 CONSUMER PRICE INDEX
- Michael Thervil

- Aug 13, 2025
- 3 min read
Written by Michael Thervil

[July 2025 Consumer Price Index] There's a lot to be said about July's Consumer Price Index and a lot of it has to do with trends stemming from the labor market. Last month, it was reported by Challenger, Gray, and Christmas that there were an estimated 62,075 job cuts reported last month which was a roughly 29% increase from June of this year. Adding insult to injury since President Trump took office there has been 292,294 federal job cuts with at 2.7% increase in consumer prices as the blowback from his reciprocal tariffs take effect. Currently it is projected that there will be more job cuts coming up well into the 4 quarters of this year.
With advancements in Artificial Intelligence and the bullish stance on operational and fiscal efficiency throughout America, the name of the game for the foreseeable future is “spend less to do less”, this combined with inflationary increases and AI, translates into slower hiring, slow wage growth and less discretionary spending from consumers. This has led to the fuel of mass lay-off around the country in sectors such as transportation, retail, finance and business services in general.
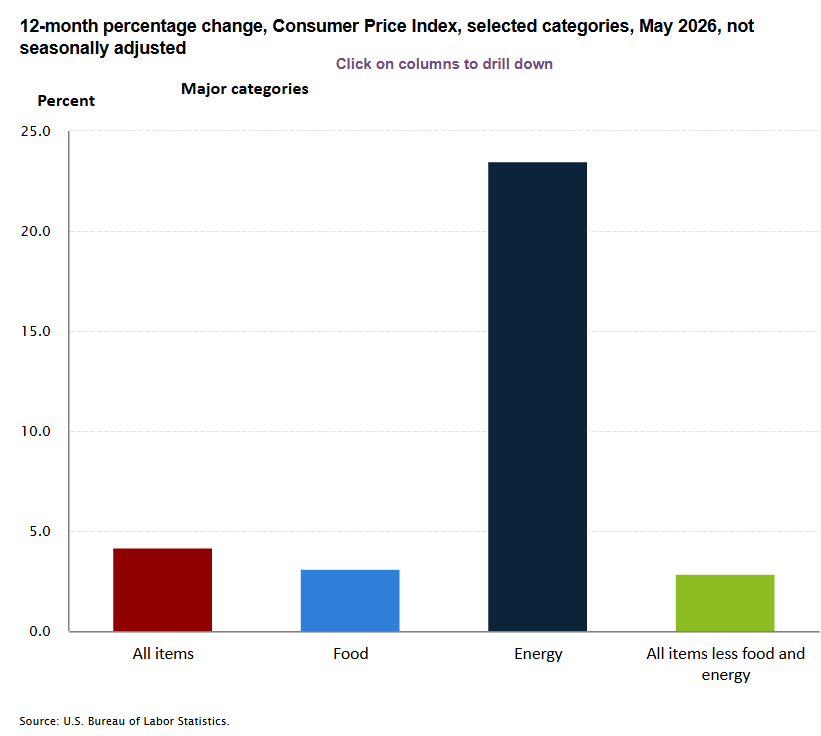
On the surface when you look at July's CPI report all sectors appear to be generally up with the exception of “Energy” (-1.6%) which has been trending into the negative over the last three months. Drilling down into “Food” which stood overall at 2.9%, the trend turned out to be the same with more people eating “Food Away From Home” (3.9%) the eating of “Food At Home” 2.2%. Looking at the “Food at Home” findings; “Meats, Poultry, Fish, And Eggs” are up 5.2% since prices have fallen in July. This increase is followed by "Nonalcoholic Beverages and Beverage Materials” which showed 3.6%. “Cereals And Bakery Products”, “dairy and related products”, and “Other Foods At Home” stayed marginally at 1%, 1.5%, and 1.2% respectively. “Fruits and Vegetables” although not in the negative stood the lowest at 0.2% growth for the month of July.
Looking at the “Food Away From Home” category, “Full-Service Meals and Snacks” took the lead (4.4%) over “Limited-Service Meals and Snacks” which stood at 3.3%. Drilling down into “Energy Commodities” which took a severe nosedive tanked to -9% while “Energy Services” increased to 7.2%. Looking at “Energy Commodities" both “Fuel Oil” (-2.9) and “Gasoline of All Types” both fell sharply with “Gasoline (All Types)” falling the hardest at -9.5%. However, there was growth shown in the "Energy Services" sector as “Electricity” grew by 5.5% and “Natural Gas (Piped)” increased by a whopping 13.8%.
In the “All Items Less Food and Energy” category which overall stood at 3.1% for the month of July, showed increases in both “Commodities Less Food and Energy Commodities” (1.2%) and “Services Less Energy Services” which increased to 3.6%. Looking at “Commodities Less Food and Energy Commodities” the two biggest growth sectors where “Tobacco and Smoking Products” (6.5%) and “Used Cars and Trucks” which stood at 4.8%. The question is why – especially will the slow job growth and mass layoff occurring at this time. All other sectors in this category such as “New Vehicles” (0.4%), “Medical Care Commodities” (0.1%), and "Alcoholic Beverages” (1.4%) showed minimum growth. “Apparel” dipped into the negative at -0.2%.
Lastly in the “Services Less Energy” category, all sectors were up. “Shelter” was up 3.7%, “Transportation Services” also increased to 3.5%, and “Medical Care Services” showed the most growth at 4.3%.


Comments